Google Ads GA4 data can help you optimize your Performance Max campaigns
Performance Max ads are touted as a way for PPC advertisers to simplify campaign management by managing Google Ads on multiple Google owned channels. It combines Google Ads channel options into one campaign, and utilizes Google’s AI Gemini to optimize budgets and ads across all channels according to performance. Although I have seen some great results with our clients’ Performance Max campaign, it has left me wondering what channels worked best. Imagine the insights you could gain from AI-driven testing and data collection for your Google Ads! [ad_1]
It could easily help you tweak and improve channel-specific campaigns and even utilize learnings from Google Ads across other ad platforms.
Exploring Performance Max data
Delving down into Performance Max data is easier said than done. Google only provides certain insights about the campaigns. For example, advertisers cannot separate out performance data by channel, such as cost per conversion or conversions, in Google Ads. Why not?
I think Google uses Performance Max to achieve two major goals. First, Google is likely to realize that certain channels of advertising, like Google Discover, are more of a branding interaction rather than a bottom-of funnel (BOFU) interaction. Since marketers are primarily measured on performance metrics, like clicks and conversions I suspect that advertisers were not interested in these ad formats.
Performance Max allows Google a conduit to force advertisers to use channels they may not have originally chosen under the guise of overall optimized performance.
However, marketers benefit from AI-optimized ad-serving, but at a cost. Performance Max is negatively affecting conversion rates. We cannot remove these channels. If Google Discover negatively affects performance, will Google stop displaying your Performance Max ads on Google Discover, or will it continue to display the ad to boost the channel’s use at the cost of optimal conversion and click performance for your campaign.
Unfortunately, advertisers aren’t able to adjust Performance Max channels and have relatively no visibility into ad channel performance.
And therein lies the conundrum with Performance Max. You may love it because of the budget optimization, or you may hate it because it lacks performance control. As Menachem Ani shares in his 2022 article, focus your effort on guiding the AI machine.
As Menachem Ani shares in his 2022 article, focus your effort on guiding the AI machine.
Create broader campaigns and learn from them
When we first started testing Performance Max for a fine wine retailer we work with, at the advice of other Performance Max experts, we created very specific wine variety campaigns, such as champagne, merlot, white zinfandel, etc. We didn’t necessarily find that this was successful. While some wine varieties did well, lesser-known varieties struggled. Even though they had a high CTR, the results were not always revenue and conversion. Using revenue data, we were able to determine which varieties performed well. Those that performed well earned their own breakout Performance Max campaign.
When testing Performance Max, consider starting with a broader category and then learning from your data to narrow it down.
You can glean this information from GA4 using an
Explorations
report (or pull the data via the GA4 API) and review item sales by campaign. Get the daily newsletter that search marketers depend on. It’s best to group keywords that are similar in search ad campaigns into one ad group. You can do the same thing with asset groups. The asset groups used the same copy and extensions, but had different images and videos.
Group B featured images and videos of beautiful vineyards or friends enjoying wine.
Group A featured specific images of wine bottles in our inventory. We used a variety brands to represent our most popular wines within that category. While Google does not make it easy to compare results, you can. Google Ads does not provide much reporting on asset groups. They are similar to the ad group in a search campaign.
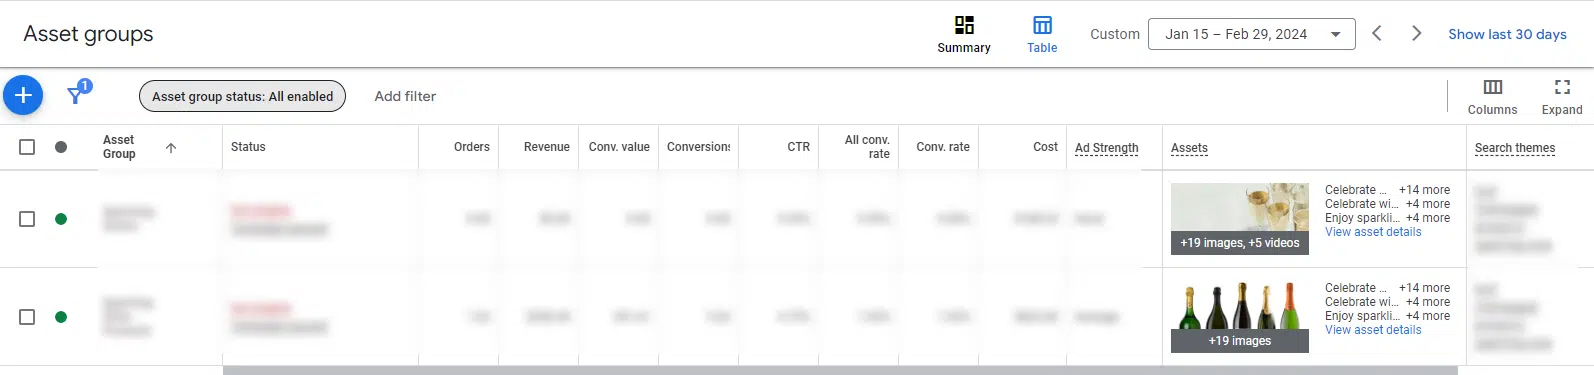
To see how one asset group performs against another in a Performance Max campaign, navigate to the campaign in Google Ads, and instead of the default asset group
Summary
view, switch to the
Table
view:
The table view provides greater detail of performance by asset group, and you can customize the columns as well, allowing you to see conversion data by asset group:
Use different destination URLs for each asset groupHowever, seeing asset group performance in GA4 is a bit more difficult. GA4 doesn’t pass on asset group data to GA4 like it does for adgroups. How can you pull together this data in GA4? The easiest way to do this is to add the tracking parameter to your asset group’s destination URL. For example, you could create a separate destination URL for each asset group using a parameter, such as
utm_creative_format
, then capture that parameter in a custom dimension in GA4. This would allow you, in GA4, to separate actual conversion data and sales by asset group as well as campaign. Ad strength doesn’t always indicate success. Typically,
. Google’s definition for ad effectiveness is not always a good indicator of success.
In the example below, both asset groups have identical assets
except
for the visual creatives. The only difference between the two asset groups is:
- The focus on the creative asset:
- The “Good” group has the most images, and the “Average group” contains the least images, and the “Average group” contains no videos.
The type of creative assets:
The “Good” group has the maximum amount of images, and the “Average group” contains the minimum number of videos.The types:The “Good” contains five videos and the “A” and the “A” and “A” and “A” and “A” and “” and “A” and “” and “A” contains 5 videos and the “A” and “A” and “” contains five videos and “” and “A” and “Sce” and “A” and “” The “” The “” and “” The “” The “A” contains the most images and the “” The “A” and the maximum number of pictures and the”.“10″

10″
“
101010101010101010101010″
10101010101010″10 The product image asset groups featuring product bottles always outperformed scenic asset groups, even though Google’s Ad Strength method suggests that scenic asset groups will perform better. The scenic asset group received more clicks, had a higher CTR but never generated revenue during the test period. Only the product image asset was able to do so. While the ad strength metric might seem helpful, you should use your actual conversions data from
. Set your ROAS goals high and then aim higher
If your ROAS goal is 200%, you will get about 200%. What if you raised it? Use Performance Max to its fullest potential. Push it to the maximum and use Performance Max for what it’s good at.
Check your outcomes in GA4 and Google Ads to see how the change impacts performance.increase your ad strengthBeware of the cross-network default channel grouping
Performance Max campaigns appear as “cross-network” in GA4’s default channel groupings. It can be tempting to group all campaigns under one aggregate grouping in order to evaluate performance. Because Performance Max is AI assisted, combining existing campaigns with new ones will not provide the same clarity as individual campaign level reporting. Avoid the temptation to rate Performance Max at an aggregated level in GA4. The opinions expressed in this article do not reflect those of Search Engine Land. Here is a list of staff authors.